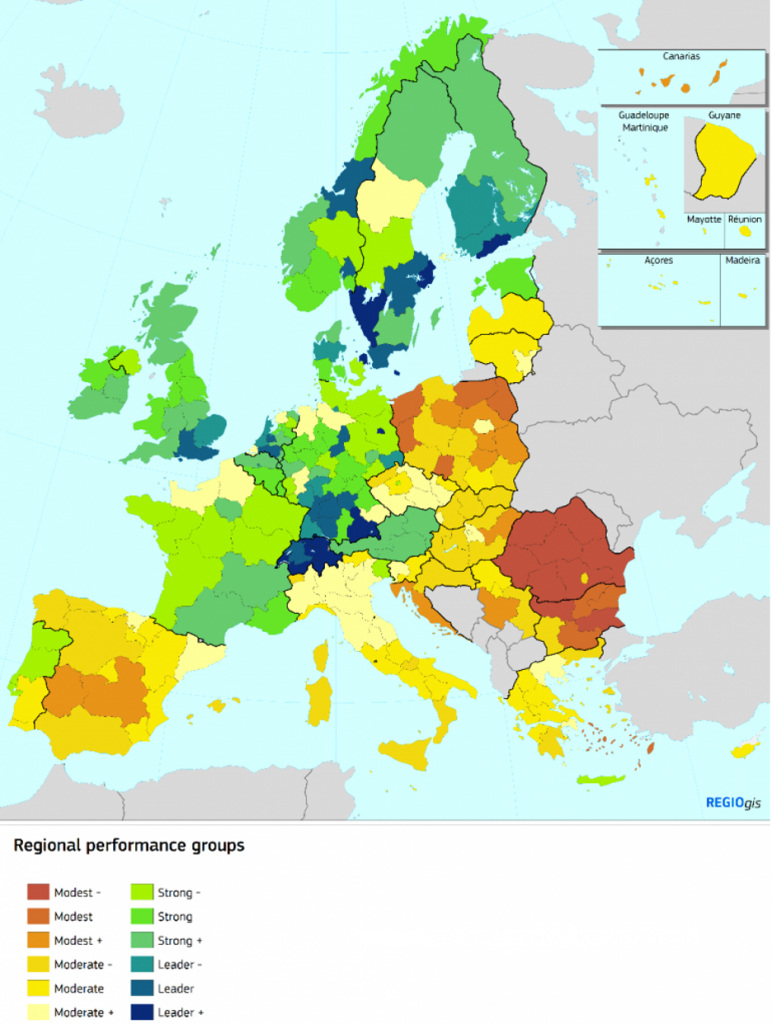
The level of innovativeness of the Podkarpackie Voivodeship in the context of European Union regions will be analyzed through the prism of indicators used in the Regional Inonvation Scoreboard. To this end, the following will be observed:
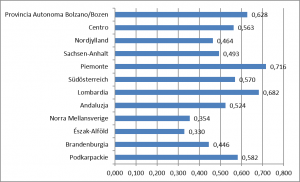
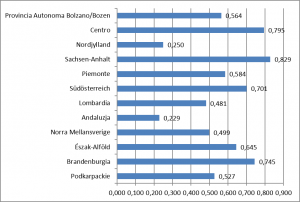
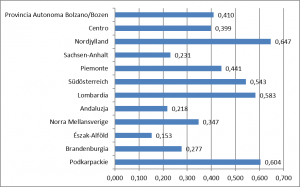
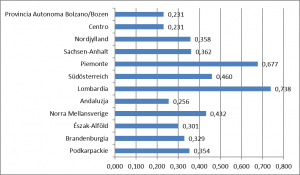
A.1. Regional Innovation Scoreboard – calculated on the basis of the analysis of the value of eighteen partial indices. In the latest Regional Innovation Scoreboard, the Podkarpackie Voivodeship has been qualified to a group of 29 regions called “moderate -“.
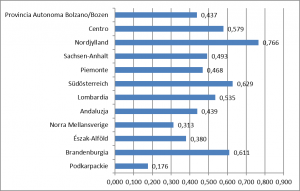
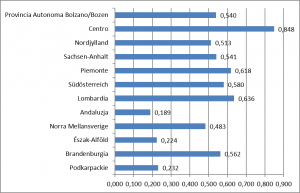
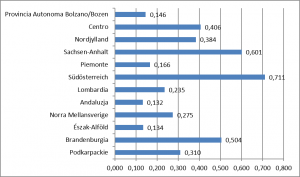
A.2. Percentage of population aged 30-34 with higher education – share of population aged 30-34 with higher education in the total population of this age category.
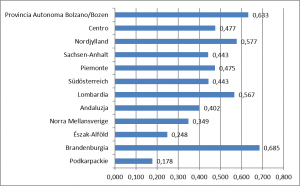
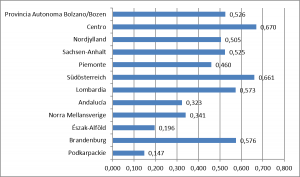
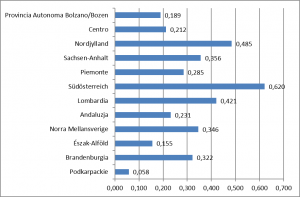
A.3. Percentage of population aged 25-64 participating in lifelong learning – share of people aged 25-64, improving professional competences (regardless of whether they relate to current or future work), in the total population of this age category . The group of people participating in lifelong learning aged 25-64 consists of households who participated in selected types of education during the 4 weeks preceding the survey.
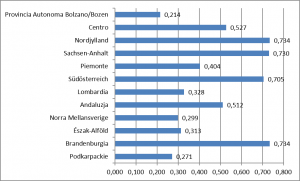
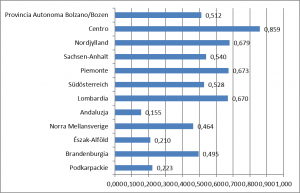
A.4. Scientific publications in international cooperation per one million inhabitants – the number of scientific publications with at least one co-author from abroad converted into 1 million inhabitants.
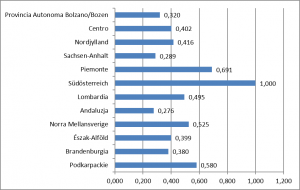
A.5. Scientific publications among the 10% of the most-cited publications worldwide as a percentage of all scientific publications of the region – the share of publications among the 10% of the most cited publications worldwide in the total of all scientific publications of the region.
A.6. Expenditures on research and development in the public sector expressed as a percentage of GDP – the sum of total R & D expenditure in the government sector and the higher education sector calculated as a percentage of regional GDP.
A.7. Expenditure on research and development in the enterprise sector expressed as a percentage of GDP – the sum of total R & D expenditure in the enterprise sector calculated as a percentage of regional GDP.
A.8. Expenditures for innovations other than R & D expenditure in SMEs as a percentage of turnover – the sum of total expenditure on innovation in SMEs (excluding internal and external costs for research and development) as a percentage of total turnover of SMEs.
A.9. SMEs introducing product or process innovations as a percentage of SMEs – participation of SMEs introducing a new product or a new process into one of their markets in the total number of SMEs.
A.10. SMEs introducing marketing or organizational innovations as a percentage of SMEs – participation of SMEs introducing marketing or organizational innovations into one of their markets in the total number of SMEs.
A.11. SMEs innovating as a percentage of SMEs – participation of innovation-introducing SMEs (product or process) in their own business or in cooperation with other companies in a total number of SMEs.
A.12. Innovative SMEs cooperating with other entities as a percentage of SMEs – participation of SMEs cooperating with other companies or institutions in the field of innovative activities (on the basis of a cooperation agreement) in the total number of SMEs.
A.13. Publications in public-private cooperation per one million inhabitants – number of publications created as part of public-private cooperation converted into 1 million inhabitants. The private sector does not include the private medical and health sector. Publications are assigned to the country in which the private sector entity is located.
A.14. Patent applications in the EPO per billion regional GDP – the number of patent applications to the European Patent Office (EPO) in the year of application, converted into one billion regional GDP in the PPS. Patent applications are assigned according to the address of the inventor.
A.15. Trademark reservation applications per billion regional GDP – the number of trademark applications submitted to the European Union Intellectual Property Office (EUIPO) per billion regional GDP in the PPS.
A.16. Applications for the application of utility models per billion regional GDP – the number of applications for the application of utility models reported to the European Union Office for Intellectual Property (EUIPO) per billion regional GDP in the PPS.
A.17. Employment in mid-high / high-level production and knowledge-based services as a percentage of total workforce – share of people employed in medium-high and high technology production (including: chemicals, machinery, office equipment, electrical equipment, communication and related equipment, precision instruments, cars, air transport, other transport) and employed in services based on specialist knowledge (water transport, air transport, post and telecommunications, financial intermediation, insurance and pension funds, auxiliary activities for financial intermediation, service activities real estate market, rental of machinery and equipment, activities related to computers and related activities, research and development, and other economic activity) in the total number of employees in production and services.
A.18. Sales of market innovations and innovations at the level of companies in SMEs as a percentage of turnover – share of the sum of the total turnover of new or significantly improved SME products in the total overall turnover of SMEs.